KB Graph
The KB Graph plugin can be used to visualize how individuals in the KB are related based on selected properties.
In the Sunflower project navigation tree, double click family.flr to load it. Click the KB Graph tab to launch the plugin. Initially all individual instances and properties in the KB are included in the graph, showing individuals in gray and property values in green. This is the Instances view, as seen in Fig. 59.
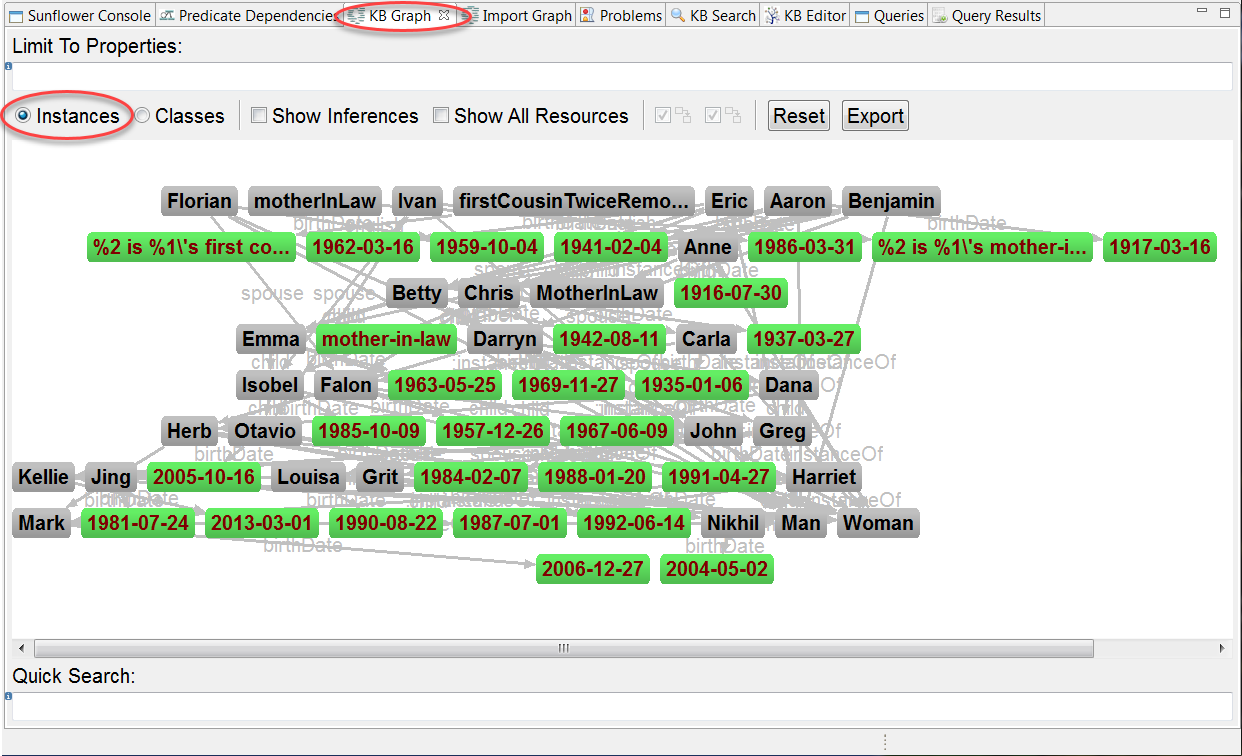
Fig. 59 The initial view of family.flr in KB Graph
Located to the left across the top of the KB Graph window is the Limit To Properties input bar. The graph can be filtered to include only those properties entered here. The Quick Search input bar, located at the bottom of the window, is used to look up individuals in a busy graph. These 2 input bars are highlighted in Fig. 60.
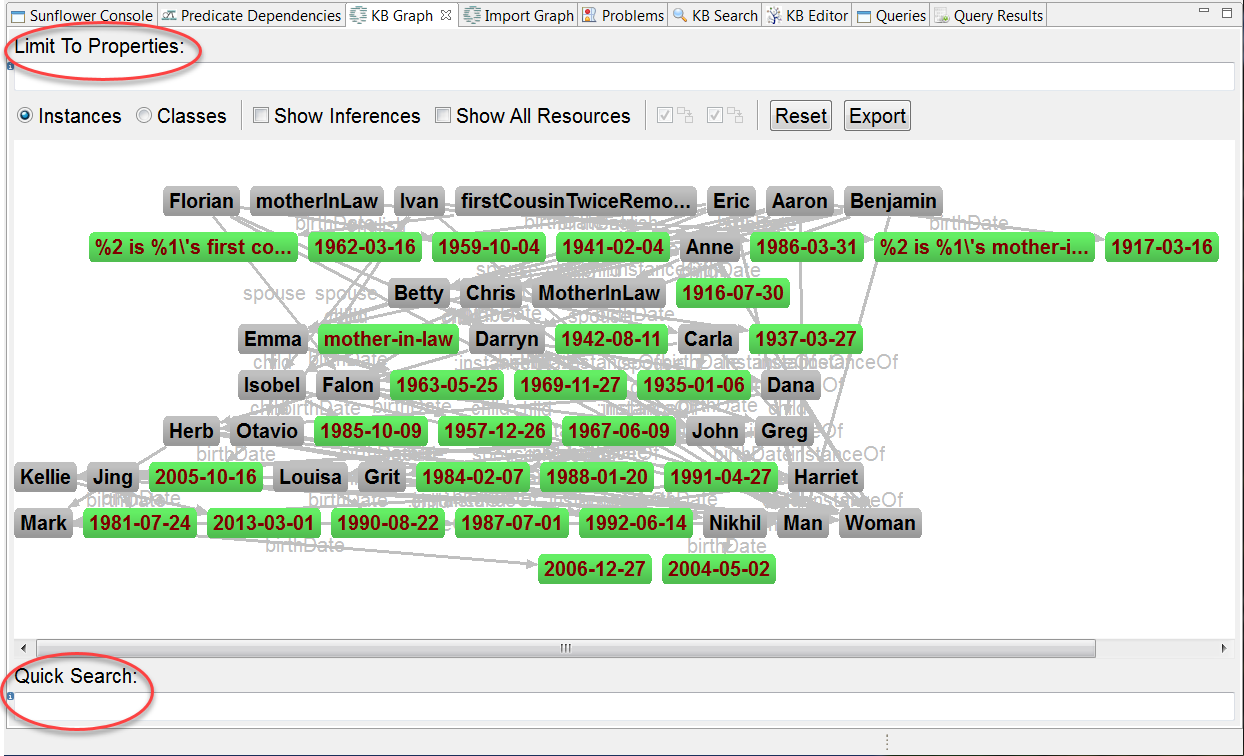
Fig. 60 Limited To Properties and Quick Search in KB Graph
Type spouse in the Limit To Properties input bar and hit return. The graph is reduced to those individual instances in the KB with spousal relationships, as seen in Fig. 61.
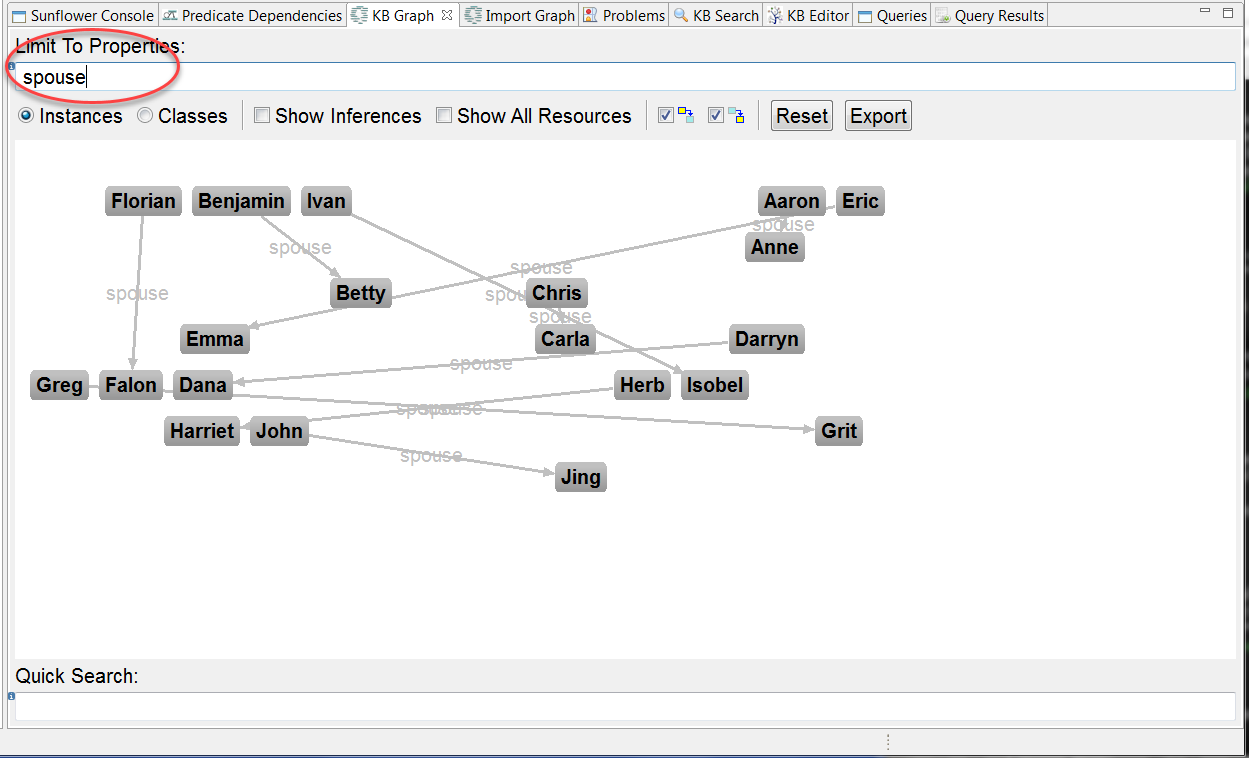
Fig. 61 KB Graph showing spousal relationships
Next to spouse, type a comma followed by child and hit return. This adds all child relationships in the KB to the graph, as seen in Fig. 62. In general, multiple properties, separated by commas, can be entered in Limit To Properties to view KB relationships based on the set of selected properties.
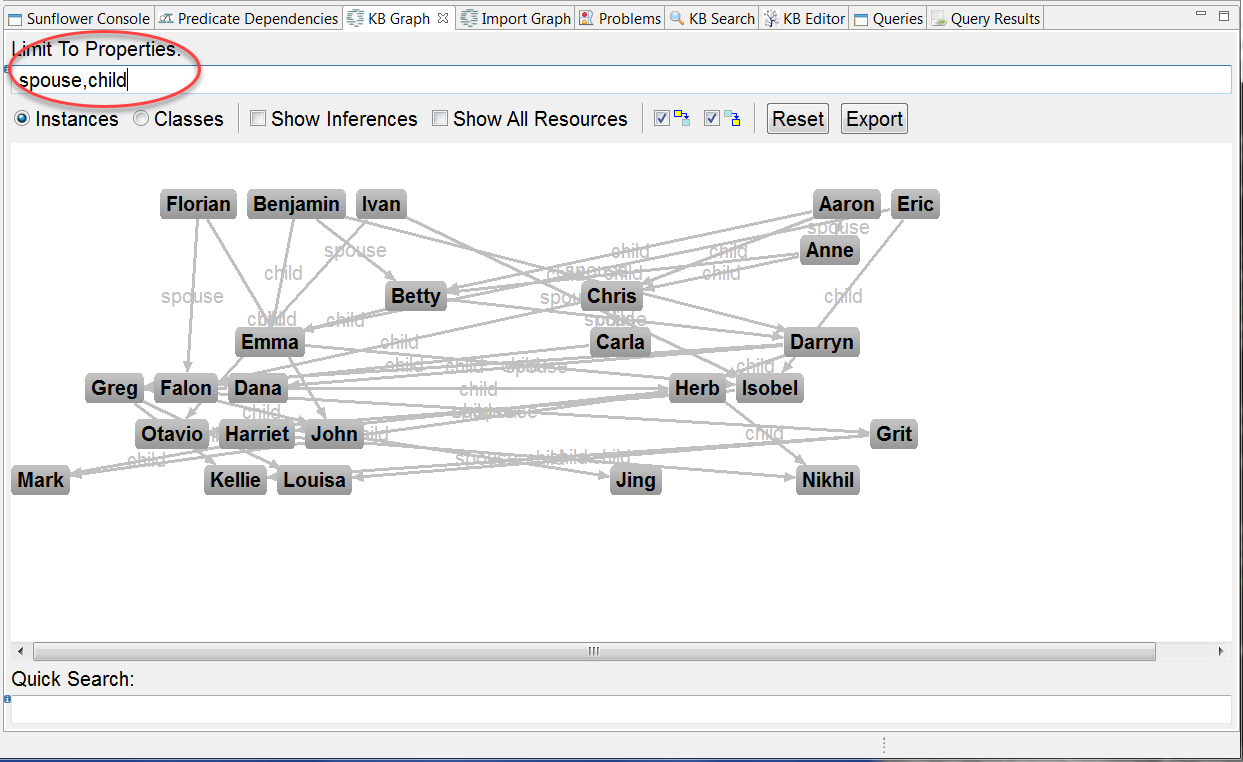
Fig. 62 KB Graph showing both spousal and children relationships
The View Dependencies from Selected Node and View Dependencies to Selected Node filters, as illustrated in Fig. 63, are for viewing connections from the perspective of a single individual. Since these 2 filters must be applied to an individual, they become activated only after an individual is selected in the graph.
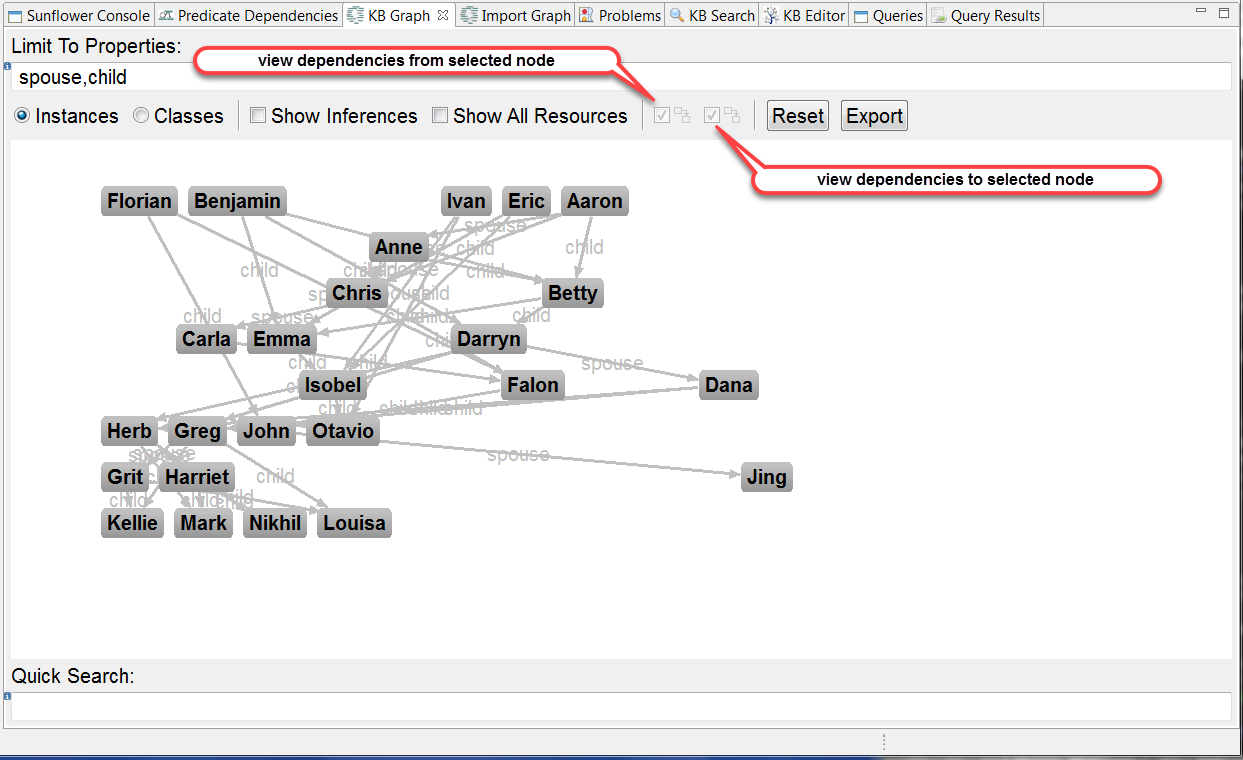
Fig. 63 The View Dependencies from Selected Node and View Dependencies to Selected Node icons in KB Graph
Click to select individual Greg. This node turns yellow indicating it is now the selected node. All other nodes which have spouse or child relationships to Greg are also highlighted, using different colors for different relationships, as seen in Fig. 64. Also notice that the View Dependenices from Selected Node and View Dependencies to Selected Node filters are now enabled. To select a new node, simply click the new node to switch. To deselect the currently selected node without selecting a new node, simply click anywhere in the background of the KB Graph window.
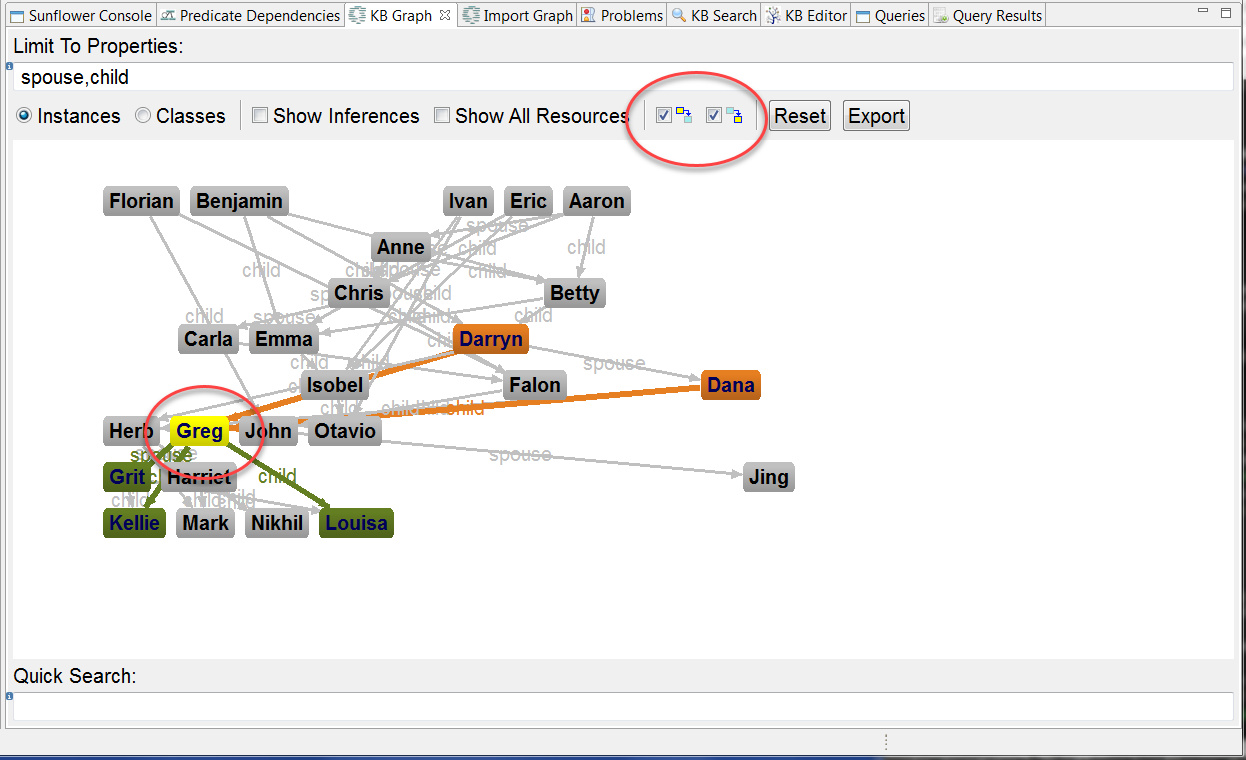
Fig. 64 KB Graph with Greg highlighted
With Greg selected, uncheck the filter View Dependencies to Selected Node to suppress spouse and child relationships to Greg. The graph is updated to reflect spouse and child relationships from Greg, as shown in Fig. 65.
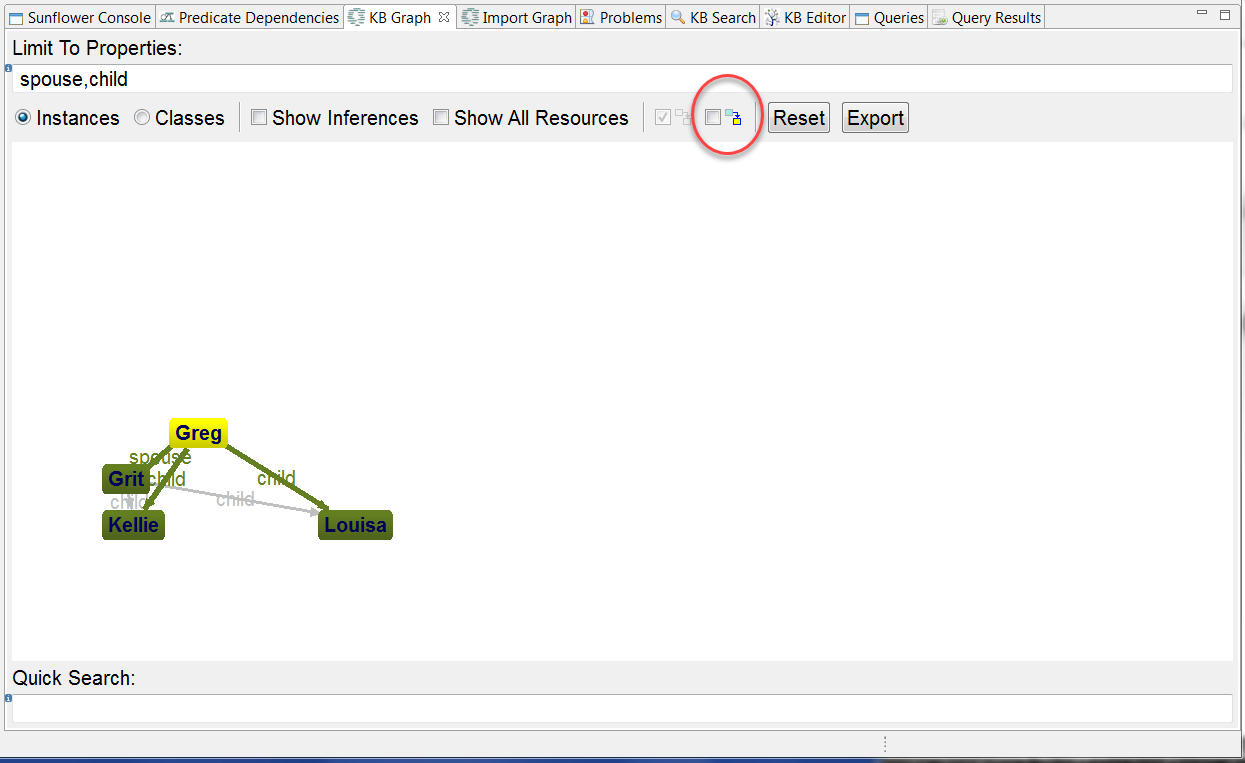
Fig. 65 KB Graph showing spouse and child relationships from Greg
Click Reset to restore the graph to the default Instances view. Repeat typing spouse,child in Limit To Properties and hit return, then click to select Greg. Uncheck the filter View Dependencies from Selected Node this time. The graph is updated to show spouse and child relationships from other individuals to Greg, as seen in Fig. 66. Note that placements of individual nodes in the Instances view after a Reset may be slightly different each time.
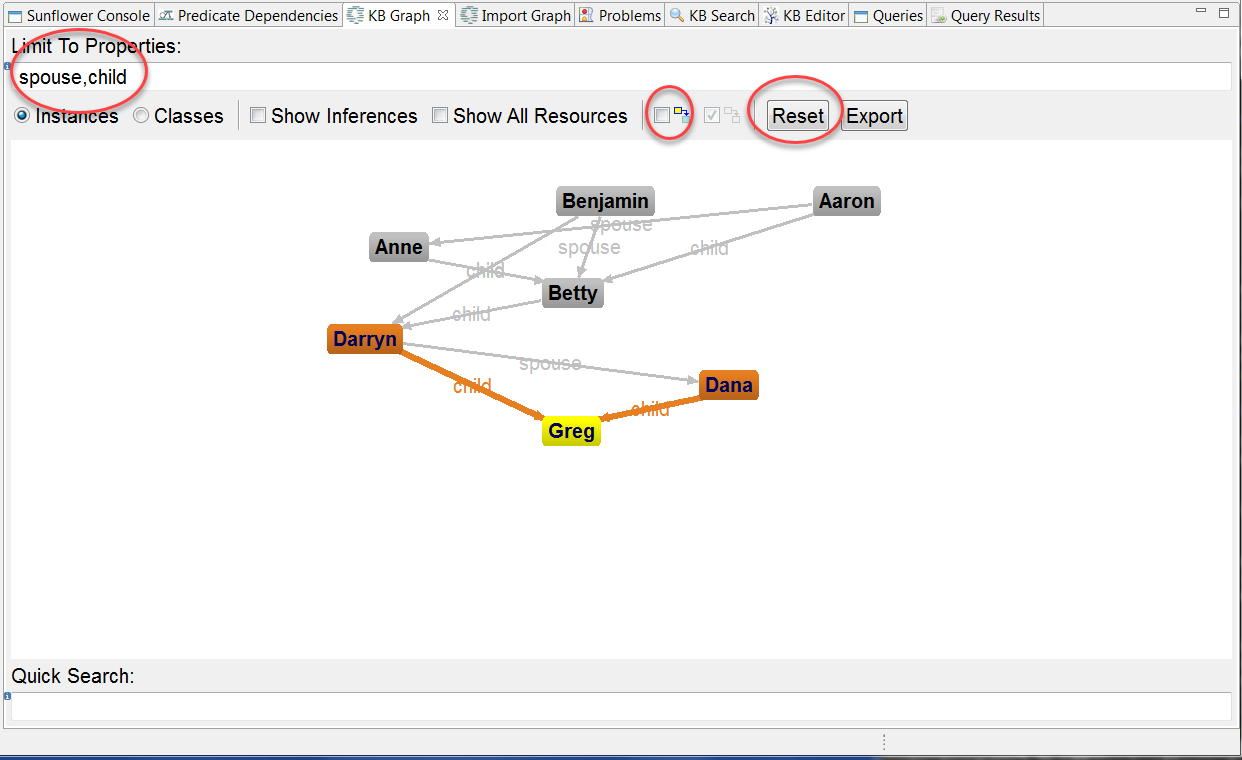
Fig. 66 KB Graph showing spouse and child connections from other individuals to Greg
Do Reset again to return to the default view. Click in the background to deselect Greg. Double click individual Isobel in the graph. This produces a relationship graph centered on Isobel, as seen in Fig. 67. In general, double clicking an individual in the graph filters the graph on that individual and limits the graph to relationships pertaining to that individual.
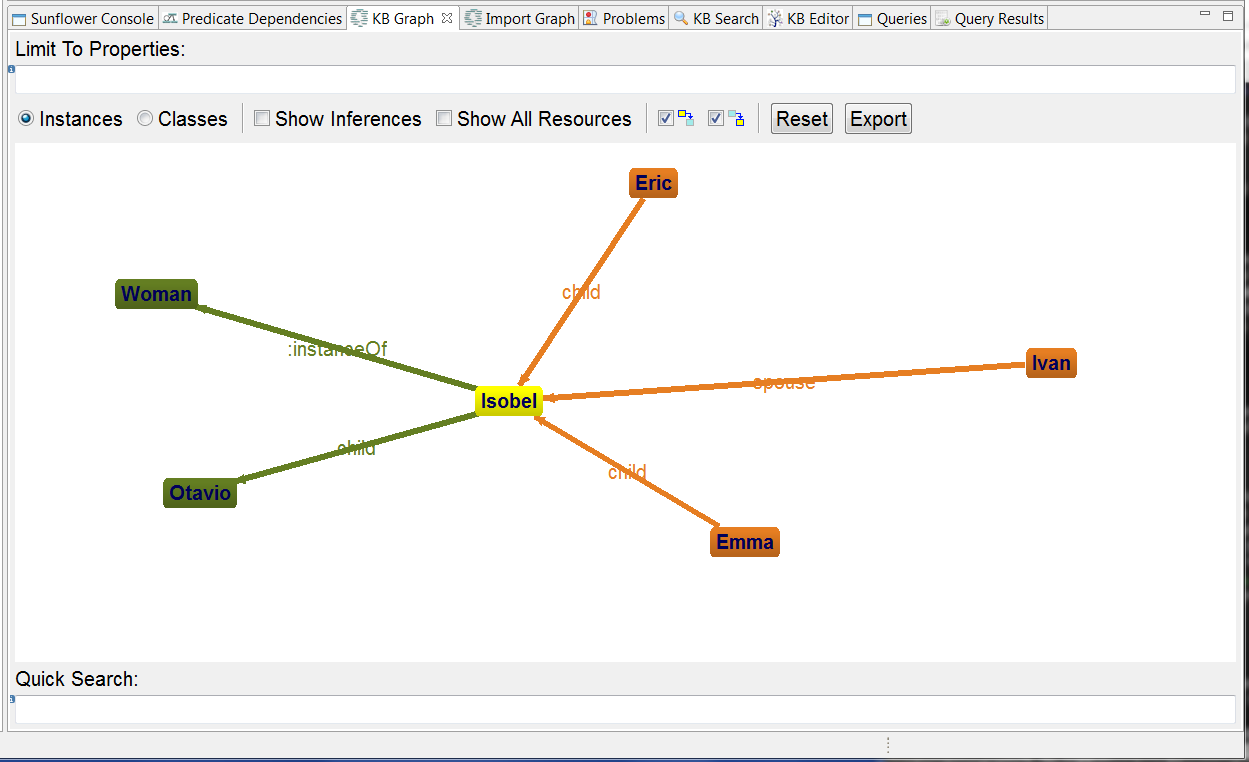
Fig. 67 KB Graph centered on Isobel
Type child in “Limit To Properties”. This reduces relationships in the graph to only child relationships for Isobel, namely, Emma and Eric have child Isobel, and Isobel has child Otavio, as seen in Fig. 68.
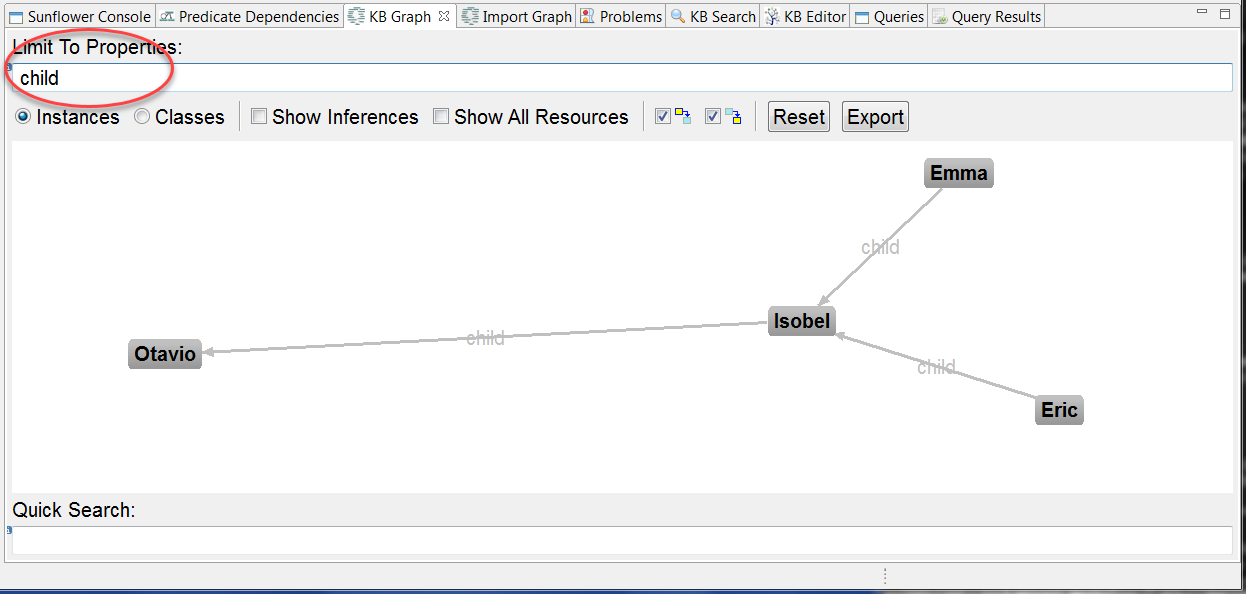
Fig. 68 child relationships for Isobel
The Quick Search utility located at the bottom of KB Graph can help highlight a node in a busy graph. A list of possible choices for highlighting is available by typing CTRL + Space in the Quick Search input bar, as shown in Fig. 69.
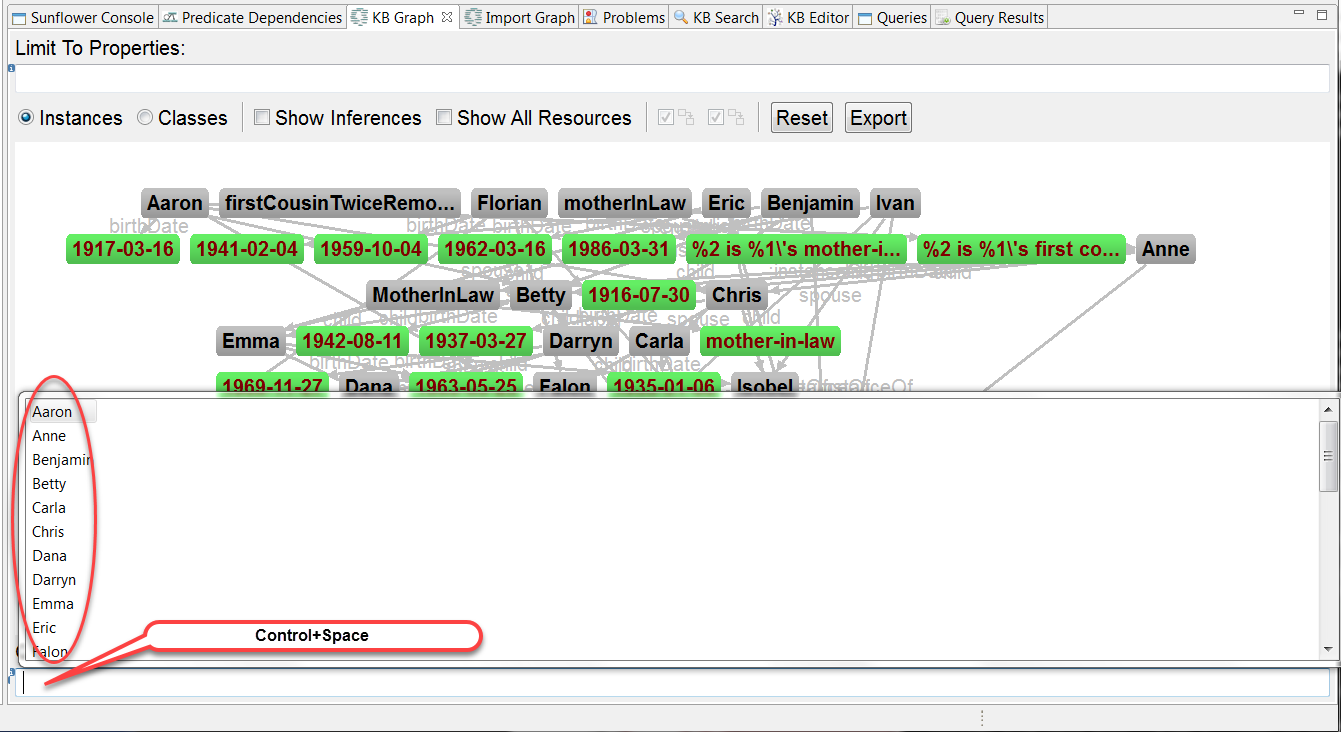
Fig. 69 CTRL + Space reveals a list of possible choices for Quick Search
The little blue i icon to the left of the input bar, when hovered over with the mouse, shows a helpful reminder message of the CTRL + SPACE choice list, as shown in Fig. 70.
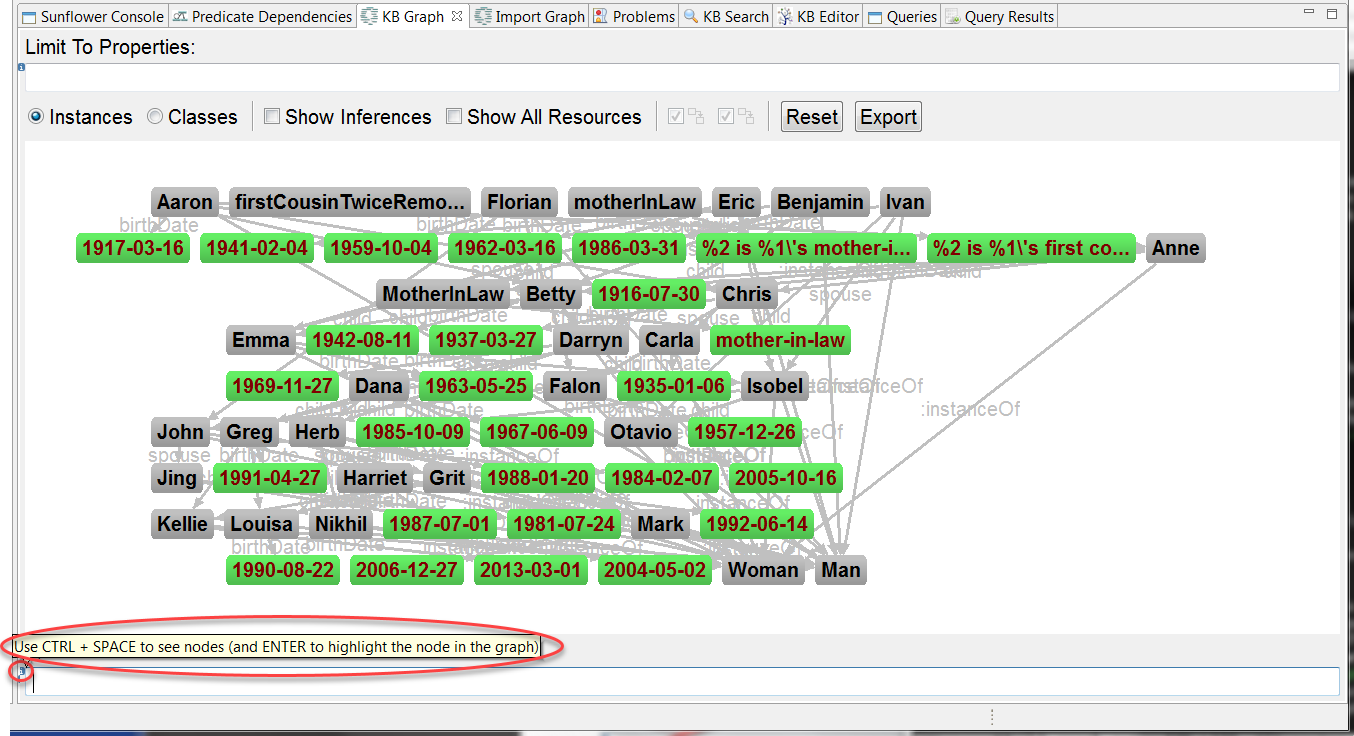
Fig. 70 Message displayed when blue i icon is hovered over
To use Quick Search to highlight a node, do Reset. Click inside the Quick Search input bar to enable input. Either directly type Isobel or use CTRL + Space and select Isobel from the list, then hit return. The Isobel node changes color to yellow and becomes easily identified in the graph, as seen in Fig. 71. Note that Quick Search is case insensitive, which means inputting isobel or Isobel will find and highlight the same node.
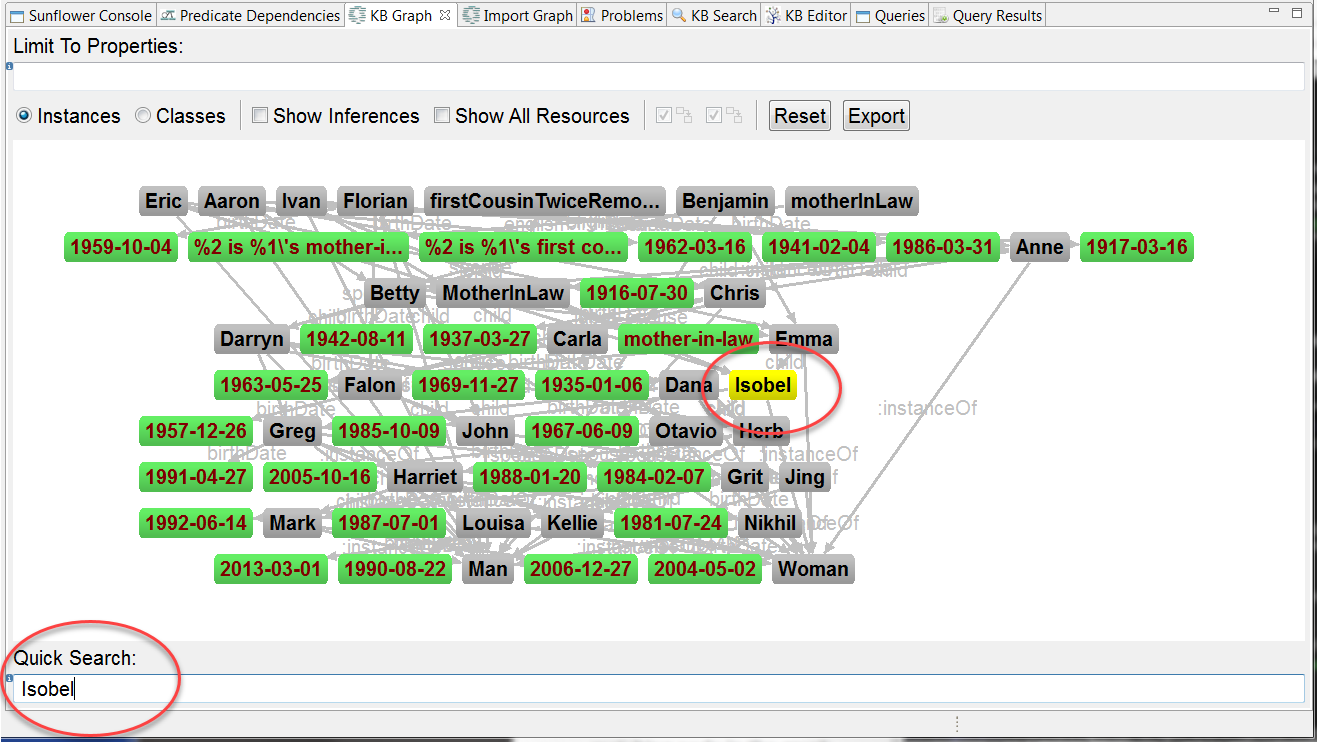
Fig. 71 Node Isobel is highlighted in KB Graph using Quick Search
To highlight multiple nodes using Quick Search, simply add additional names one after another in the input bar, separated by commas. For example, after Isobel, type ,Carla,John,Louisa and hit return. This will highlight additional nodes Carla, John and Louisa, as shown in Fig. 72. Another way to highlight a group of nodes in KB Graph is to use the click and drag method to define a rectangular region within the graph. When the mouse is released, nodes encompassed within the rectangular region will be highlighted.
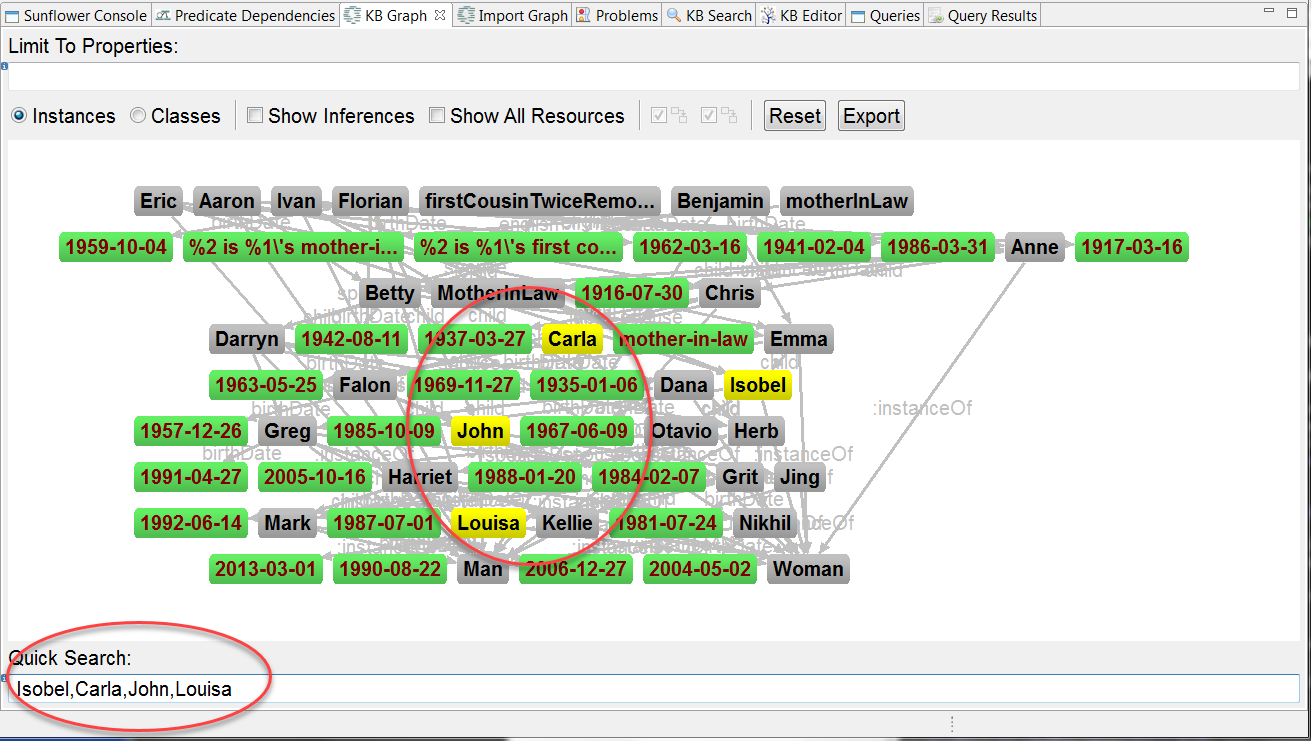
Fig. 72 Nodes Carla, John and Louisa are also highlighted
In KB Graph, a highlighted node can be dragged to another location in the graph. If there are multiple highlighted nodes, they move together as a group when one of the highlighted nodes is dragged. Fig. 73 shows the effect of clicking to highlight node Isobel then dragging it to the right. Other highlighted nodes Carla, John and Louisa are moved in the same manner as well.
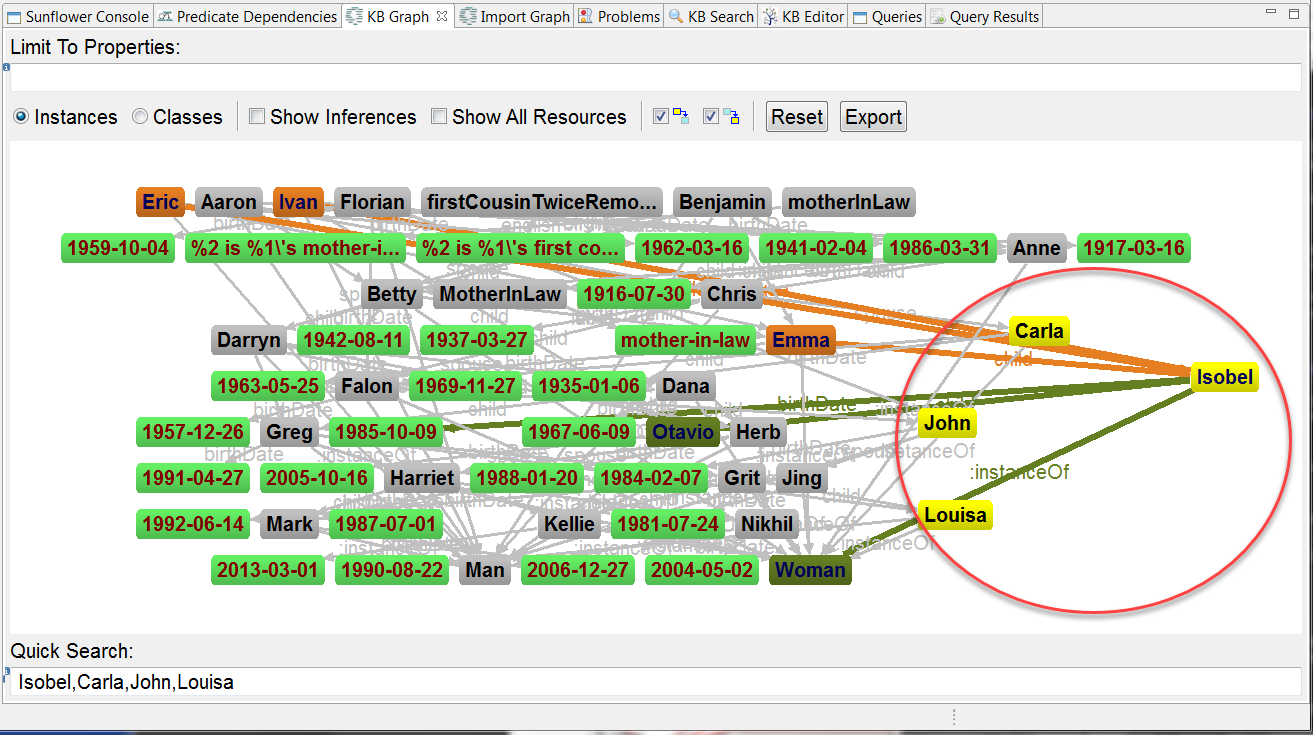
Fig. 73 Nodes Isobel, Carla, John and Louisa are relocated as a group
Nodes highlighted using Quick Search can be deselected by removing their names in the Quick Search input bar and hitting return. Alternatively, a mouse click anywhere in the backgroud will also deselect highlighted nodes.
Class Diagram
Besides being used to display relationships among individual instances, KB Graph can also be used to display relationships among classes based on properties selected. The Classes button in the KB Graph window, as shown in Fig. 74, is used for showing class relationships.
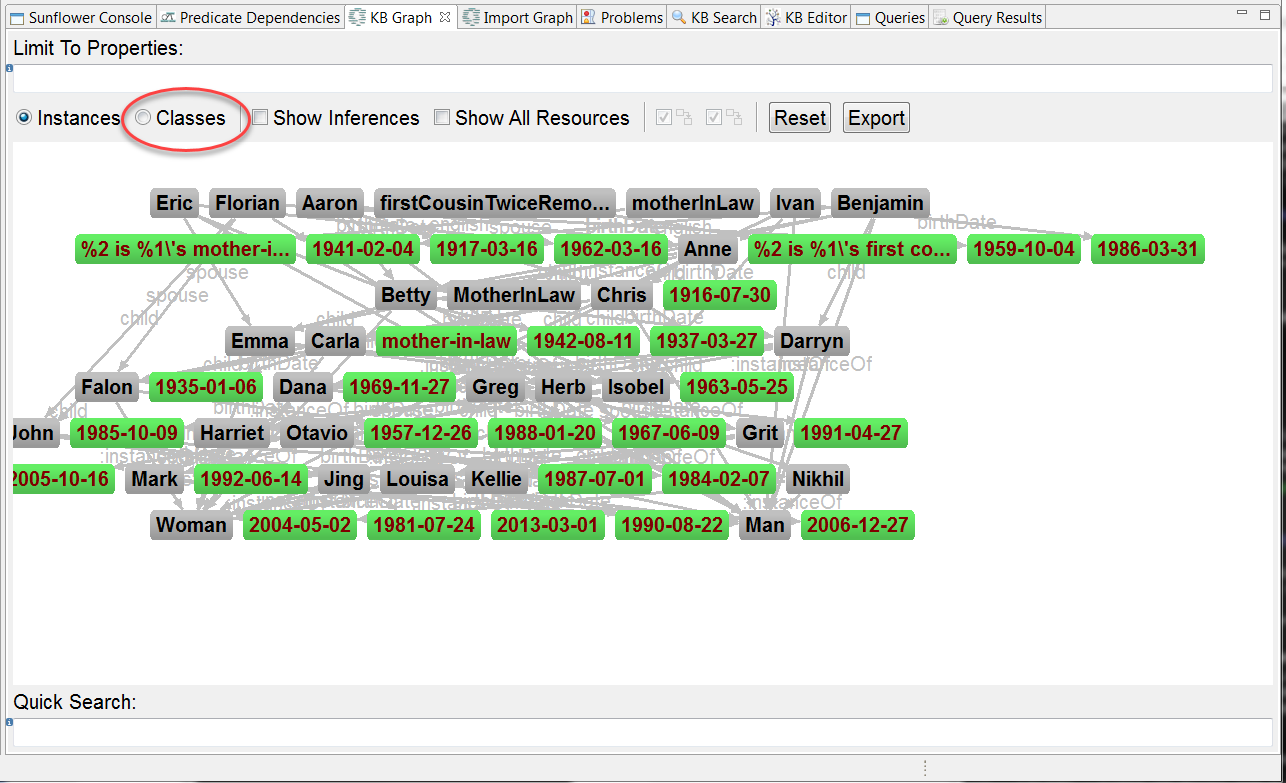
Fig. 74 Classes button in KB Graph
With family.flr loaded in Sunflower, click to launch the KB Graph plugin. In the KB Graph window, type spouse,child in the Limit To Properties input bar and hit return. Spouse and child relationships of individuals are displayed in the KB Graph window, as seen in Fig. 62.
Now switch to Classes mode by selecting the Classes button. The Person class to which the 2 selected properties belong is now displayed in the KB Graph window, as shown in Fig. 75. The self referencing arcs emanating from spouse and child indicate that both properties are instances of the Person class, as defined in family.flr.
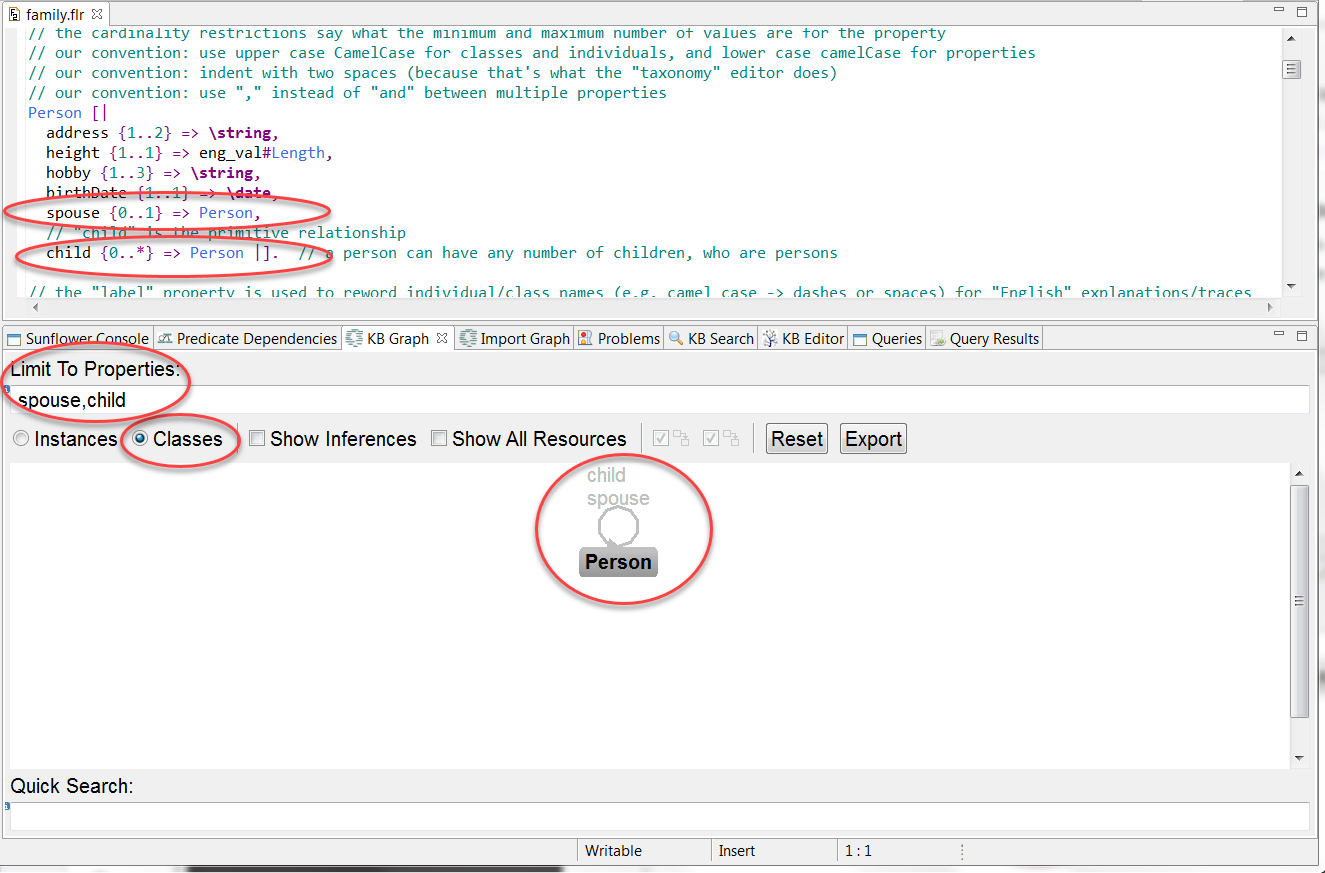
Fig. 75 KB Graph shows Person class to which properties spouse and child belong
Add height to the Limit To Properties input bar, and hit return. The height property is not added to the KB Graph, as shown in Fig. 76. This is because the eng_val#Length class to which height belongs is not defined in the local file family.flr.
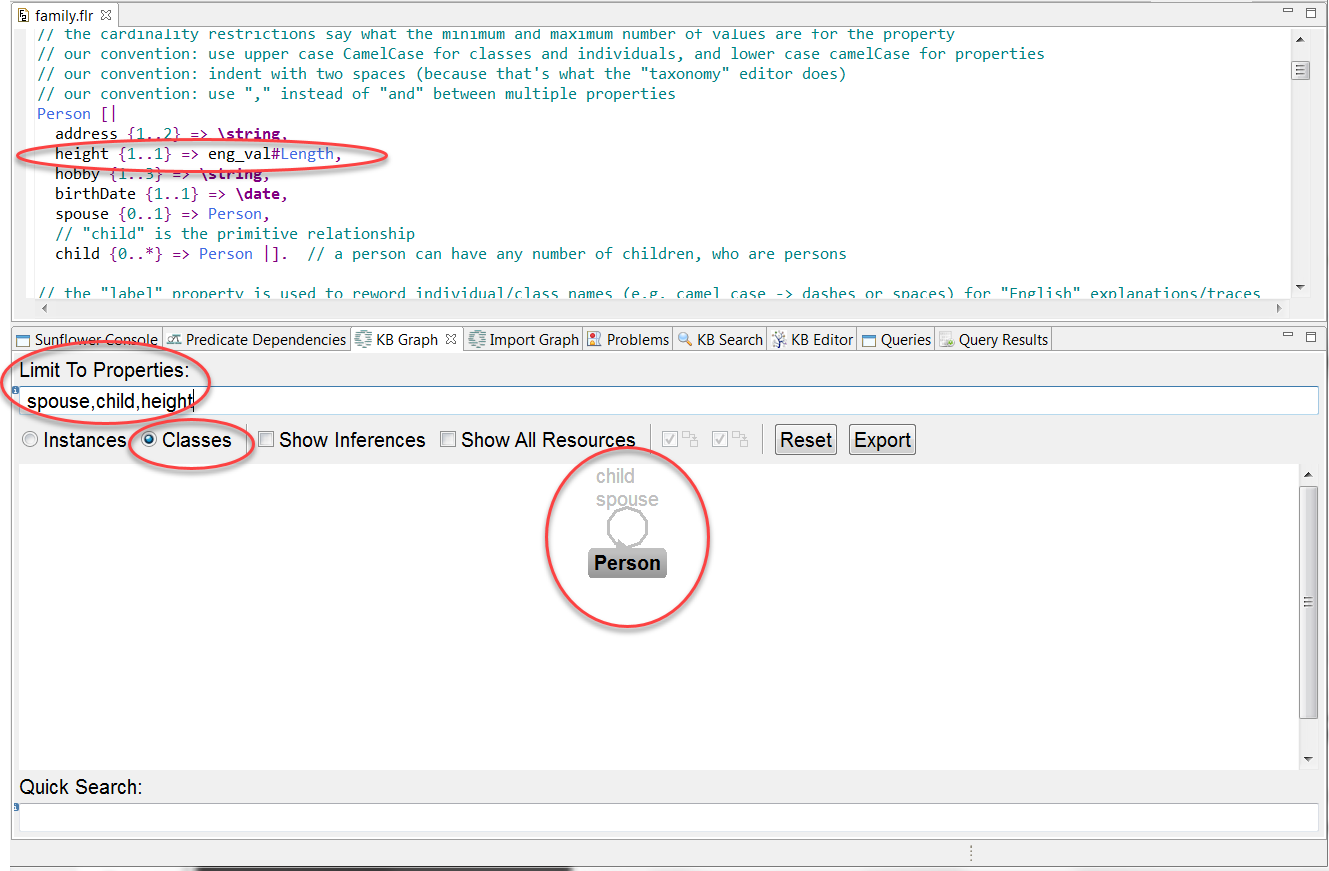
Fig. 76 Property height does not show up with class it belongs to in KB Graph
To see height added to KB Graph, check the Show All Resources box to include classes from other imported resources. Then property height and class eng_val#Length show up, as illustrated in Fig. 77.
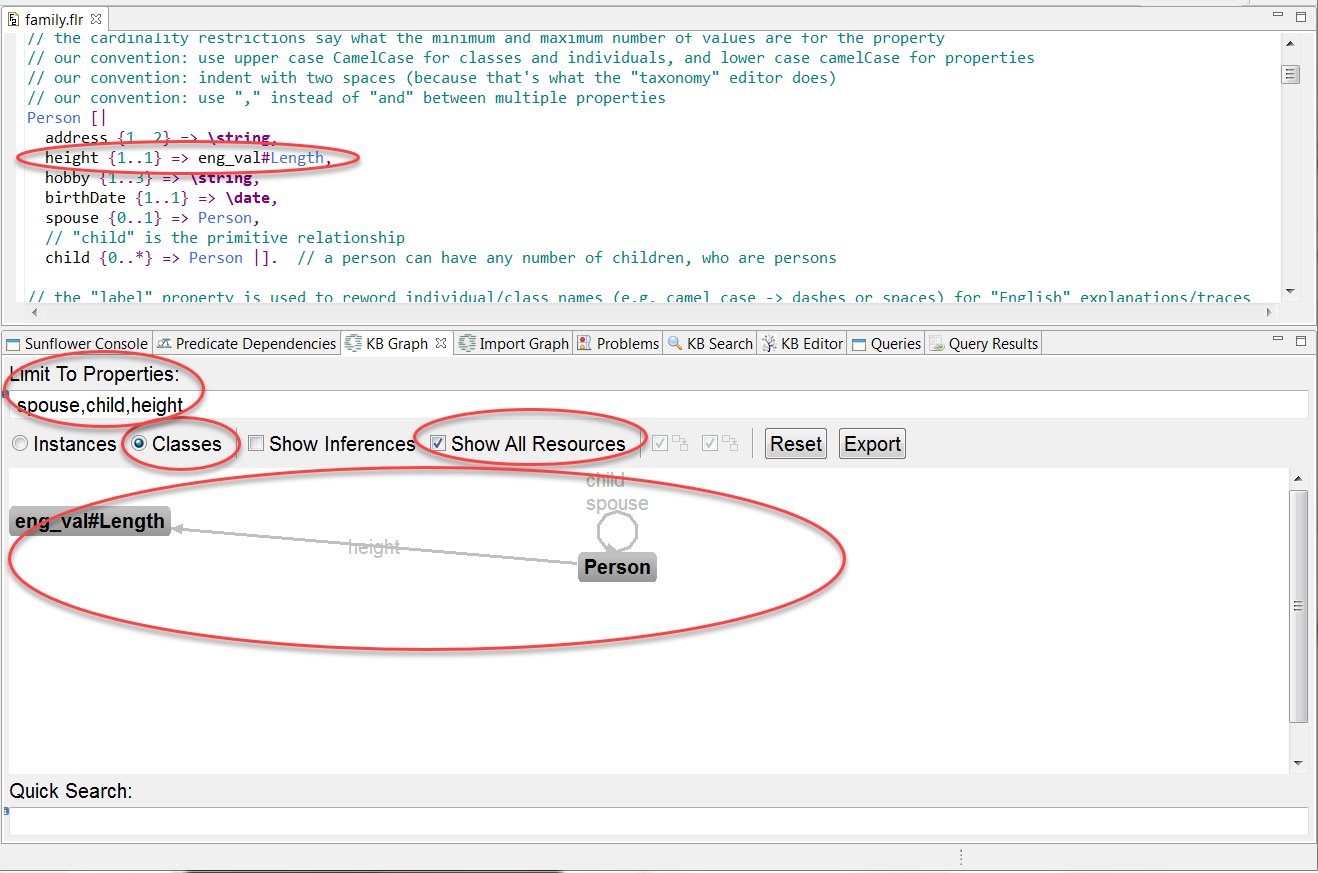
Fig. 77 KB Graph shows the eng_val#Length and Person classes to which the 3 properties: spouse, child and height belong